Useful tools


If you've seen me at events this summer I've quite often referred to grid frequency, grid balancing and system inertia. Keeping the grid at around 50Hz is essential so there's a lot of forecasting and planning months, weeks, days in advance and finally in-day balancing to fine tune the system.
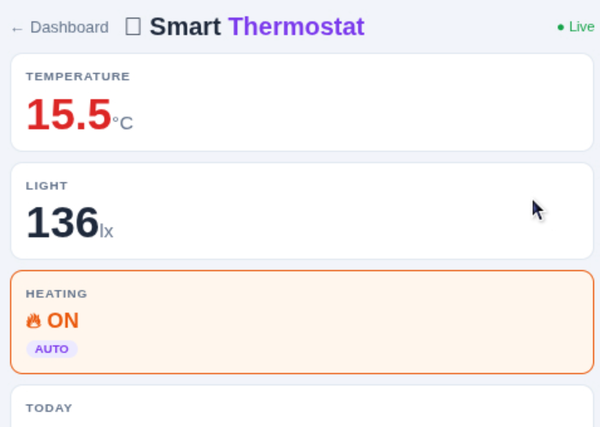
This card shows the live grid frequency right now:
This card is part of a set I've created here with arrange of other metrics I tend to find useful https://www.watt-the-grid.uk/home/ but message me if there's others that could be displayed too.
Historically frequency was mostly supported by inertia - essentially the spinning mass of a large generator. If something is spinning it can cope quite well if a bit more load is applied but if you've monitored the voltage of a battery you'll see a drop as more load is applied. With the increase in solar and wind generation inertia becomes a new challenge to deliver.
We can also see the balancing adjustments through the day live too.
What governs balancing is the forecast and actual generation and interconnects. Visible in the data is the transmission level generation (i.e. big stuff) and interconnects, but generation that's attached at the local distribution grid level (DNO) which is typically solar farms and smaller on-shore wind generation is mostly a calculation and referred to as Embedded generation. With increased embedded generation then forecast and having balancing options available is becoming harder.
The other three cards are weather, carbon intensity and our Agile import/export tariffs. Weather obviously impacts everything on this suite of cards whilst carbon intensity depends on weather, demand and therefore the mix of mainly gas as a proportion of the grid. When we look at what this all means we end up with Agile tracking the resulting wholesale market.
In addition to these I've also been experimenting with other tools
From time to time I get asked about the benefit of trading a battery on our Agile import and export tariffs, so there's a page on the same site where a set of choices are used to give a historical guide. For example if I have a battery that's capable of storing 10kWh, can charge/discharge at 3kW rate and I want to know what would have happened in August 2026 then it'll calculate (with assumptions) what that would look like. This is pure battery arbitrage ignoring any home consumption and solar generation which will clearly impact the available state of charge of the battery according to the best import/export agile times. But at least a good guide of the scale of trading. The tool also ignores the benefit of flexibility schemes too.
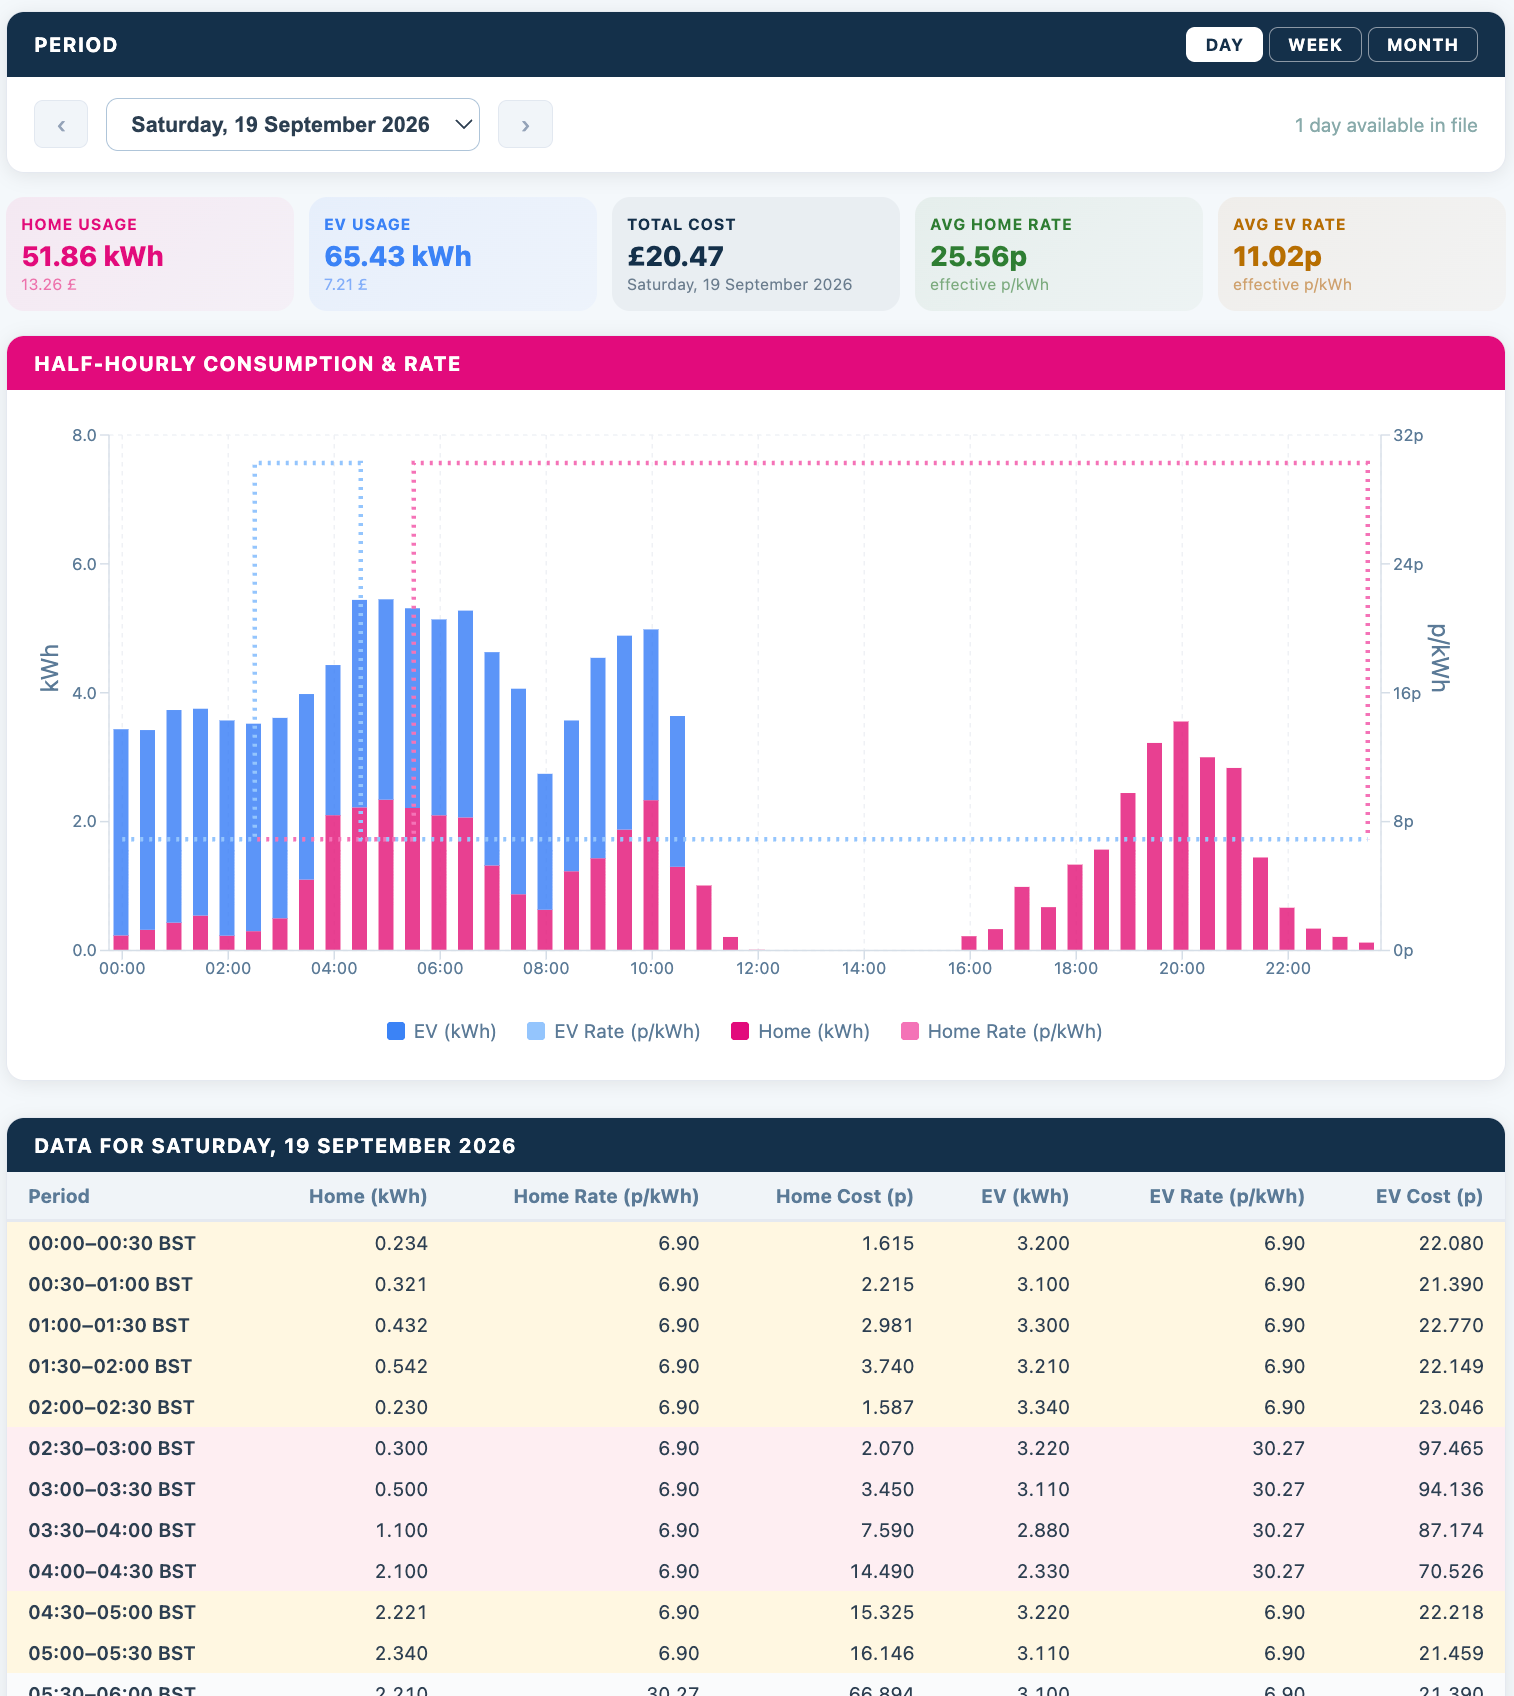
I've also created a simple tool that uses the IO-Go (6-hour cap version) csv data to present a graph similar to the old daily statement view - try it out here: https://www.watt-the-grid.uk/usage-csv
I'd love to here if there other tools and data you'd like to see too.